Predicting chess with machine learning
Overview
The site here is powered by two primary machine-learning models, trained on and built for elite classical chess. There’s a paper published on Zenodo.org which explains the technical aspects of the work in more detail. Here in the blog I’ll try to provide a more readable explanation.
The models have seen lots of elite (2400+), classical chess games, played since 1994. Training covers about 464,000 of these games, sourced from The Week in Chess. The models learn to predict the likelihood of all three results at each half-move (ply) during a chess game, and they also predict the likelihood that a strong player will select each of the available candidate moves in the position. They are then evaluated on a separate set of 82,000 games, to prove the generalizability of the results. Their predictions are based on a combination of engine evals (for played moves, candidate moves, recent moves), positional features, how players have performed so far during the game, and some other ideas. The version on the site does not include the actual rating difference of the players. Everything is predicted from the move list and the average Elo level of the players.
Accuracy
I believe these models (gradient-boosted decision-tree ensembles, LightGBM) have state-of-the-art performance on these tasks. There are various ways to measure this accuracy.
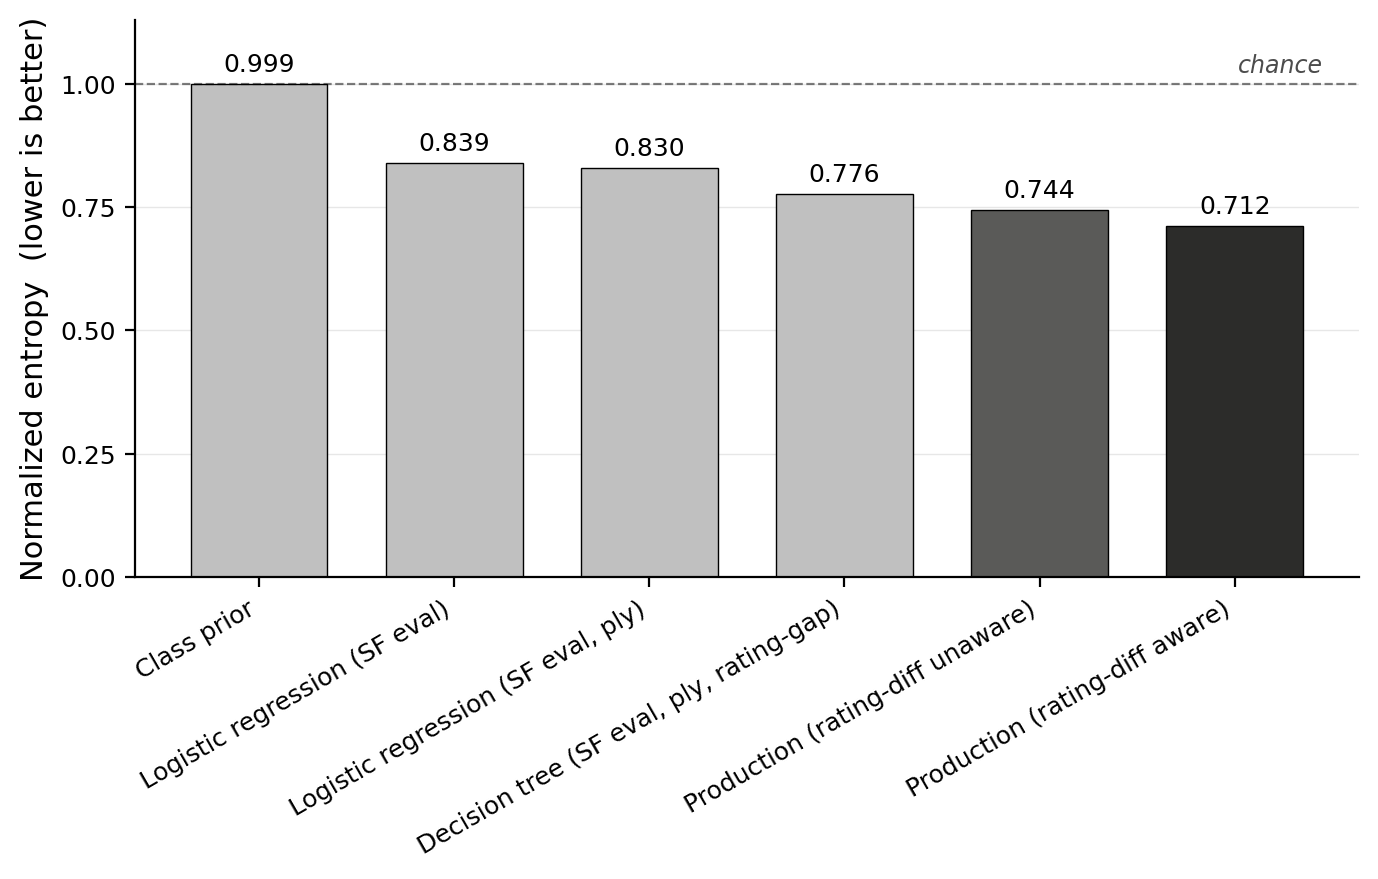
- For result prediction, it’s a three-class classification problem. One way to describe accuracy is to speak of “calibration”; a model is well-calibrated if its predicted probabilities match observed probabilities over large samples of data. In practice a more technical measure is used, “Normalized Entropy.” This compares the mistakes made by the model (the “loss”) to the expected amount of mistakes a model would make if it predicted the baseline probabilities (for example, 25% white, 20% black, 55% draw). Thus a well-calibrated, but random model would score 1.0, while accurate models score lower.
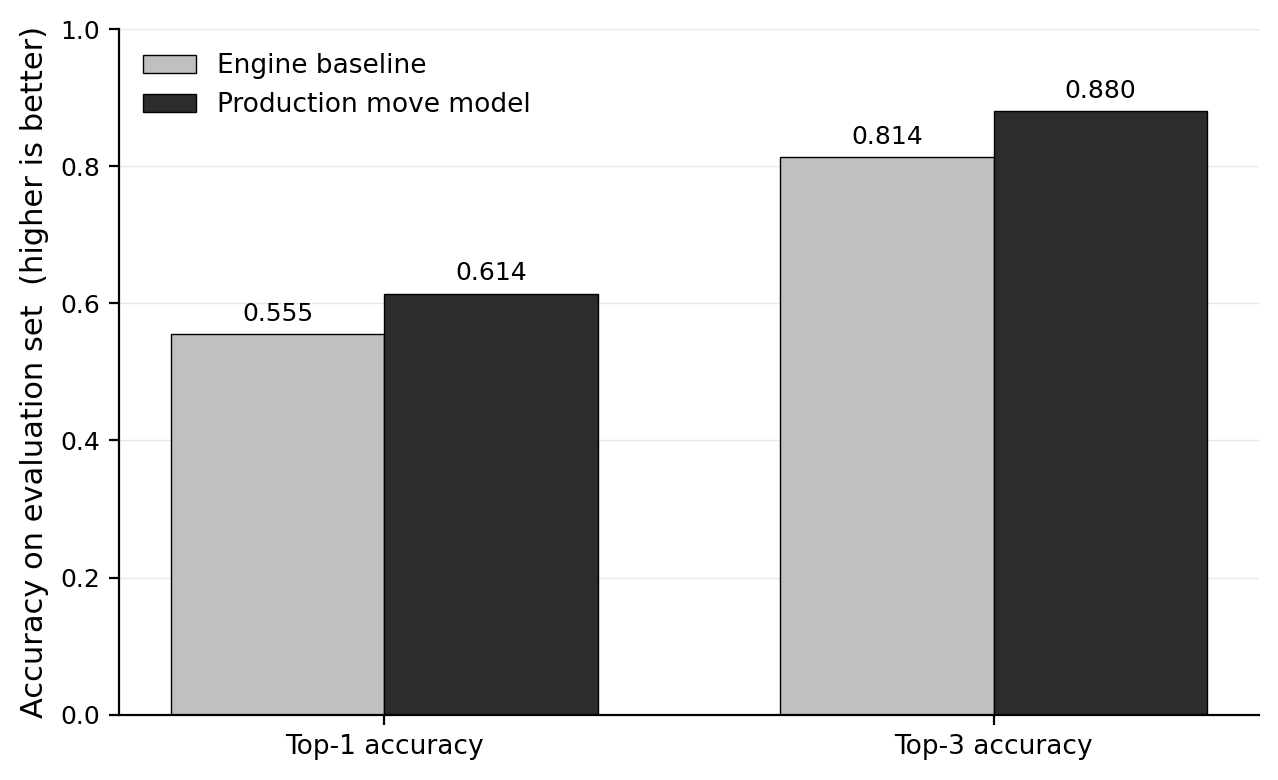
- For move prediction, it’s more straightforward. The moves played in the evaluation set games are the top predicted move by the move prediction model 61.9% of the time, and the top-three predicted moves 88.4% of the time.
The models run in two latency tiers, which take about 200ms or 1s per position on a single CPU core. Every game gets a pass with the deeper model, but the faster versions are available for live analysis of fast games.
Scaling behavior
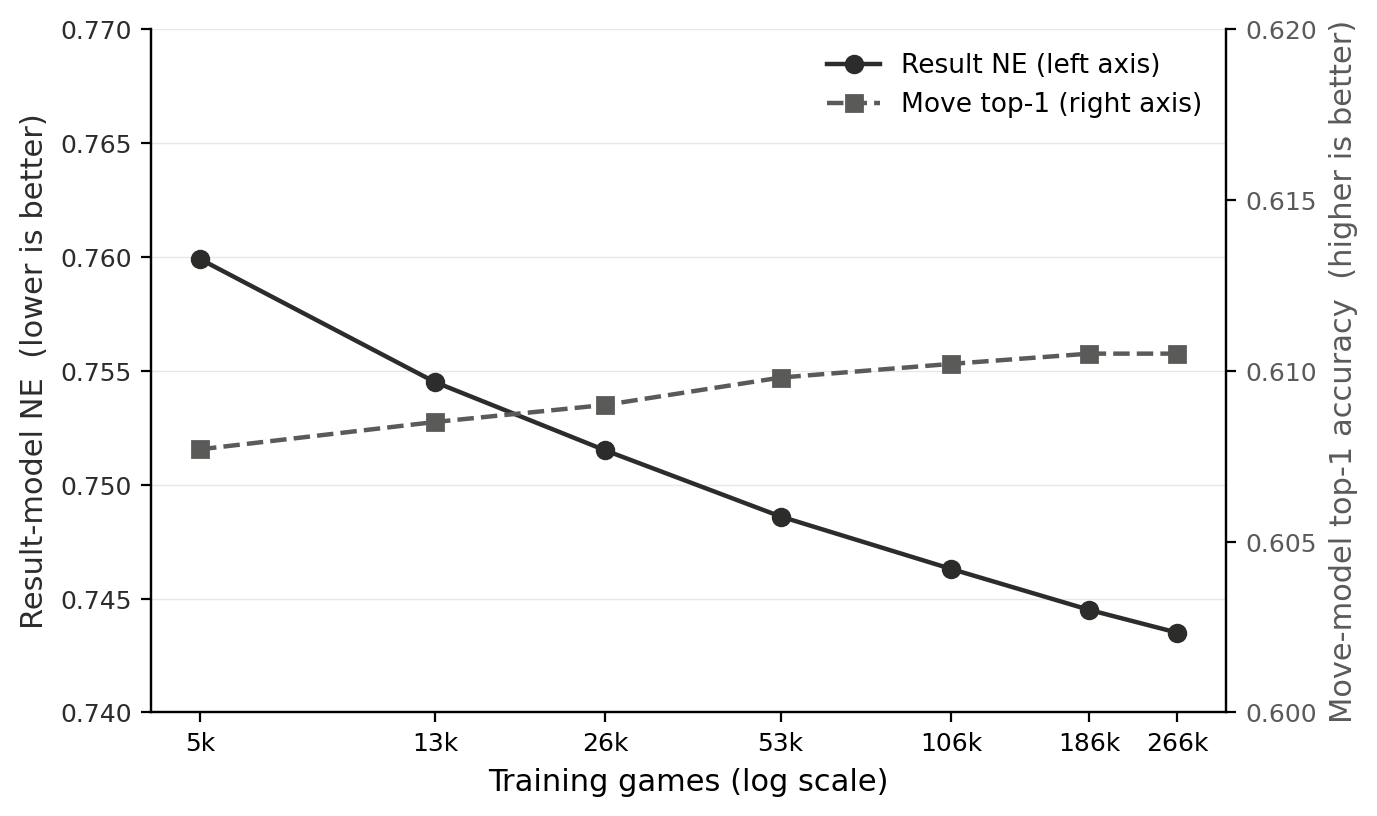
Both models were trained at nine nested training-set sizes from 5k to 464k games (each a subset of the next), with every other setting held fixed within each sweep, and evaluated on the 82k-game holdout. This is interesting to see if the models are still improving (and should be fed more games!) or have plateaued (and need more clever features, or a new model arch if improvement is possible). It looks like our current models have more room to grow in result prediction, which makes sense. We really have fewer examples there, as results are more strongly and cleanly correlated across moves within a game than are move-level choices. Both curves are monotonically improving (or flat) across every point. The marginal gains from additional data shrink sharply past about 100k games.
Method, in brief
For the ML-audience, this has been a fun project and it would be great to discuss with others! Both models are LightGBM gradient-boosted decision-tree ensembles. The result model is a three-class softmax over win/draw/loss; the move model is trained with the LambdaRank objective, with each (game, ply) treated as a query group, with the played move as the single relevant candidate. Inputs are position-level feature vectors: ~140 features for the result model and ~70 for the move model. The features draw on Stockfish 18 evaluations of the current position and its candidate moves (with careful management of hash tables), the move sequence leading to the current position, properties of the position itself, and the players' Elo ratings. A small upstream policy network (~1.2M-parameter ResNet trained on the same TWIC pool with cross-entropy on the played move) produces policy-derived features that feed the move model directly, plus a smaller set of position-level summaries that feed the result model. Inference is sequential within each game: positions are fed through the pipeline in order so that history-derived features describe the actual game history up to the current ply.
Full results, including per-slice tables, calibration analysis, comparison to prior work, and dataset/method details, are in the PDF.
How to cite
@techreport{hamood2026chessds,
  author      = {Hamood, Albert W.},
  title       = {Well-Calibrated Result Probabilities and Human Move
                 Prediction for Elite Classical Chess},
  year        = {2026},
  month       = {May},
  institution = {Zenodo},
  doi         = {10.5281/zenodo.20387841},
  url         = {https://doi.org/10.5281/zenodo.20387841}
}