XPAR: a new method for ranking elite chess players
Ranking XPAR is a new measure for ranking top chessplayers, designed to be a better sporting measure than the universally used Elo ratings. While Elo ratings have undeniable value, they are subject to inflation and deflation, and they offer no reward for activity. I wanted to try something different, leveraging the XPA approach and updated models.
It’s live now at chessds.com/rankings. Here I’ll explain how it works.
What XPAR is
You’ll now find “XPAR” all over the site, with a number that reads like an Elo rating. This is Expectation Points Added (XPA, for the game, player, or event in question) compared with expected play of an average human GM, translated to an Elo-style rating. This translation is fit on play from 2004-2007. Considering recent work on deflation, my hypothesis is the rise starting from this time is driven by the wide availability of powerful engines, so it feels like a good place to anchor. I’m hoping XPAR reflects the true increase in playing strength since then.
For rankings, step one is to produce the XPAR number for each game, player career, and event. Then we can produce the weekly rankings, adding a focus on recent action.
Producing XPAR
- Move-by-move GM expectation is calculated by integrating over all legal moves with at least 1% probability to be played. Note the model used here is not the model providing the probabilities you see on the game page; it’s a less accurate one, which throws out features that can leak player strength. Each move contributes its change in game expectation according to the result prediction model, weighted by its chance to be played.
- For the played move, the expectation change observed is compared with this average GM expectation change. If the best move was played, it will score above average GM level, and XPA will be positive. But how positive depends on the difficulty of the position – positions where the best move is less likely for a human to find will tend to have higher expected error. In simple positions with little at stake and many equally good moves, choosing the best one offers little reward.
- An opponent strength adjustment is applied. This comes from the empirical observation that XPA is affected by opponent strength, such that having a stronger opponent leads to worse XPA. I won’t get into this further now, but a simple correction factor improves the measure. This factor never uses Elo ratings – it’s built from opponent XPA (unadjusted) on earlier games only, and it weights the opponent’s recent play more strongly.
- The move-level measure is converted to an Elo-style rating, based on a player-level fit of XPA to Elo rating from classical games between 2004-2007.
Producing Ranking XPAR
Ranking XPAR considers, for each player, all their classical games from the last two years, counting the most recent year double. Players need 20 games in the window to qualify. The central number is a player-level average of all moves, however players are ranked by the lowerbound of the 90% confidence interval. Confidence intervals are based on archive-wide observations of typical single move variance for a player of that XPAR level. So width depends both on player strength and games played.
These choices are mine, but they were all lightly defended statistically. There is a lot of game-to-game variance, so it takes some games before a tight relationship with Elo rating emerges from average XPAR. The two-year and one-year cutoffs are arbitrary, but in my mind, sporting!
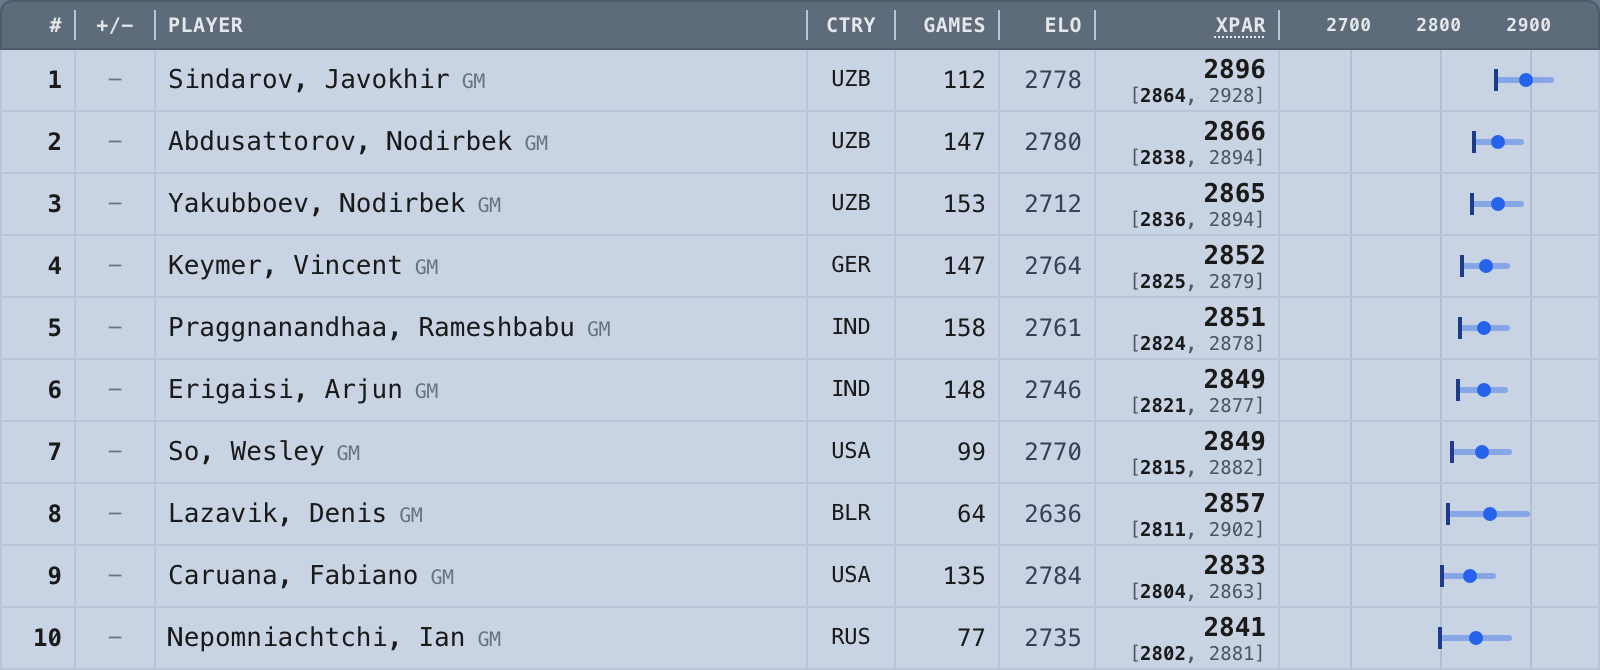
Here’s a visual example of the rankings at launch. Each player’s XPAR number is shown visually with a blue dot. The confidence interval is shown by the horizontal blue line, and players are ranked according to its left end, marked with a vertical line:
Supporting data
The most basic check I used to validate XPAR results was to measure the player-level correlation with Elo, within 2-year windows. XPAR models do not use DSC inputs, and they don’t produce the predictions that are shown for games on the site now; those models are too good! They learn to understand player strength and vary their outputs accordingly, but for XPAR we need a signal of what a typical GM would do, that doesn’t vary (too much) based on the player.
This is hard! For one thing Elo itself is imperfect, so disagreements don’t necessarily mean XPAR is worse. And there is plenty of natural variance in performance that Elo doesn’t capture. Still it’s a good baseline. XPAR shows a stronger correlation with Elo rating than the site’s previous XPA model:
How could we understand if XPAR was actually a better measure of strength than Elo? We can try to see if it is more predictive of future results. I compared XPAR and FIDE Elo on their ability to predict tournament results. Using logistic fits, and ratings at the start of events, I measured the error between fit projections of tournament scores by Elo and by XPAR. As the number of games grows, XPAR gets more and more predictive. By the time we have a few dozen games analyzed for a given player, XPAR is more predictive of future tournament outcomes than FIDE rating. In my test, this is statistically significant at 88 games (which many top players in the archive have).
This is also available for all past players. On the chessds.com/rankings/history page, you can view XPAR ratings for any interval of years, or produce a line chart with XPAR over time for any players you like (requires at least 15 games). This has been really fun for me to play with, and I’d be interested to hear about anything that stands out as you browse.
Caveats
I’m definitely not saying this is a perfect model! There are at least a couple things to be wary of, and this is likely always going to be a work in progress.
- The impact of playing styles is unknown (but likely small). I’m not too worried about this, as both tactical and positional players can show up rated highly, and the correlations with Elo and results are strong. The amount of stable deviation from expected XPA <> Elo relationship at player level is small. But I haven’t thoroughly tested this; it’s not easy to do since computing player “style” is also a difficult problem.
- Actual results are not considered at all. It does really matter who wins and loses a game! This is partly baked-in by measuring move quality in terms of game result expectation (only about 2% of decisive games have the loser with higher XPAR). But it does feel a bit weird, and you could imagine that some players really excel when the pressure is on to win a key game. XPAR treats all games the same.
- XPAR is not on today’s rating scale. It’s worth repeating: XPAR is designed to anchor to 2005-era FIDE ratings, and thus to represent the true improvement since then. It will run higher than current ratings, which is expected, and consistent with earlier deflation research.
- The numbers are not permanent. Booked Elo ratings never change, but model improvements or coverage changes here will affect ratings. I’m not planning any changes soon and would manage them carefully, but this is an output of modeling work which will progress further in the future.
Looking ahead
I’ll be producing these rankings going forward, aiming for a weekly cadence building on theweekinchess.com/twic data. Doing this well requires great coverage of classical events for top players, so I’d also appreciate if there are any gaps noticed among top 200 open or women’s players.